
Abstract
Published operating evidence from Freeport LNG, Calcasieu Pass and Corpus Christi demonstrates three different limitations of conventional LNG utilisation comparisons: the system boundary being measured, the population being compared and the capacity reference applied.
Freeport's 2022 shutdown illustrates why physically intact liquefaction trains do not necessarily imply dependable LNG exports. The published increase in US terminal utilisation excluding Freeport illustrates how commissioning effects can influence aggregate results without demonstrating improved mature-facility operating effectiveness. Corpus Christi's progressive expansion illustrates why year-end capacity cannot automatically serve as the denominator for production delivered throughout the year.
These observations do not establish avoidable production losses at any named facility. They show why the distinction between a measured difference, an unexplained residual and an achievable opportunity is consequential to production expectations, reliability investment and capital allocation.
A technically credible production forecast can reflect known interruptions and operating constraints without independently establishing the limits of achievable performance. Comparable external evidence can test that expectation, but does not automatically establish a recoverable opportunity.
Introduction – When the comparison changes, but performance may not
In June 2022, the shutdown of Freeport LNG removed approximately 2 billion cubic feet per day of US LNG export capability. During the same year, a published industry analysis reported that average utilisation across US LNG terminals excluding Freeport increased from approximately 86% to 91%.
The contrast appears straightforward: one facility experienced a substantial interruption while the remaining export system achieved higher reported utilisation.
But what, precisely, improved?
The industry analysis attributed much of the aggregate increase to the recent commissioning of Calcasieu Pass, which did not require the planned maintenance normally associated with an established facility.
The reported increase therefore did not establish a corresponding improvement in the underlying operating effectiveness of mature LNG terminals.
For LNG operators, these distinctions matter because utilisation figures inform production forecasts, reliability assessments and investment decisions. The question is not simply which facility reports the highest utilisation. It is what remains unexplained after the comparison has been made technically valid. Meeting a credible production plan does not, by itself, establish whether the plan represents a sufficiently demanding achievable expectation.
Ten major LNG assets – Scale is not performance
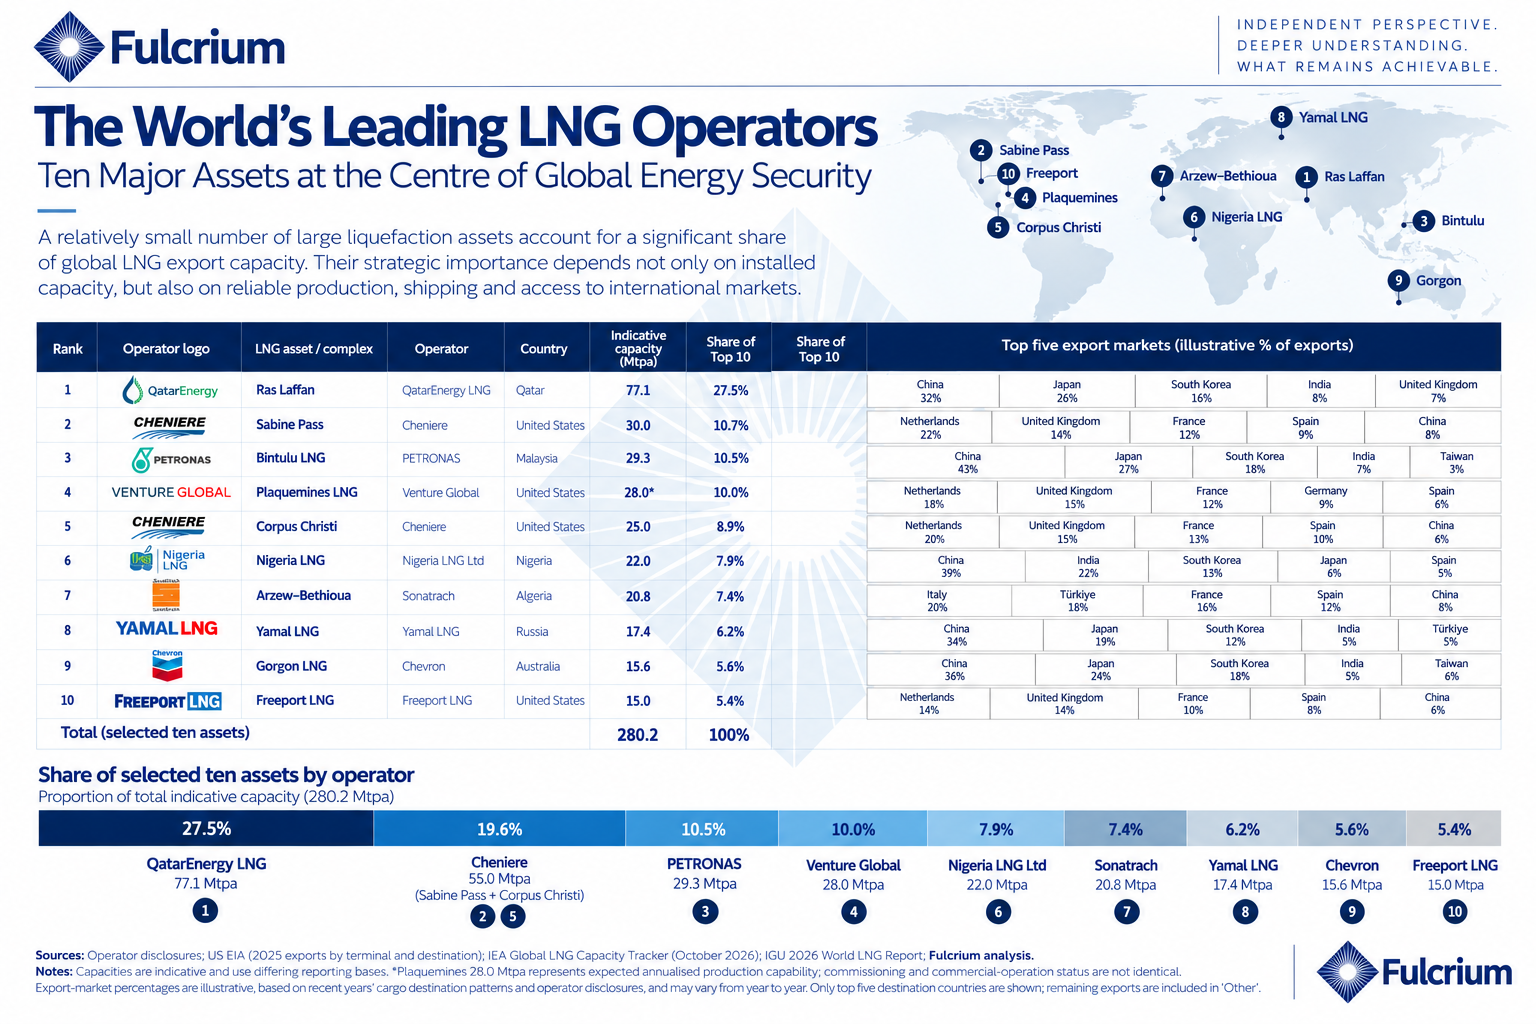
The accompanying Fulcrium infographic identifies ten major LNG liquefaction complexes: Ras Laffan, Sabine Pass, Bintulu, Plaquemines, Corpus Christi, Nigeria LNG, Arzew–Bethioua, Yamal LNG, Gorgon and Freeport LNG.
These facilities illustrate the geographical reach and physical scale of the LNG industry. They do not constitute a controlled population for benchmarking operating effectiveness, nor a verified global top-ten ranking on a common capacity-date basis.
Their liquefaction technologies, train configurations, upstream gas-supply arrangements, commissioning histories and export infrastructure differ materially. Some depend upon dedicated upstream developments; others receive gas through extensive transmission networks. Some are mature systems; others have recently commissioned additional capacity.
Consequently, installed capacity establishes neither dependable production nor the operating performance that remains achievable.
Global LNG trade and liquefaction capacity are also frequently presented together. Annual trade represents delivered volumes over a reporting period, whereas installed capacity is an annualised reference at a particular date. Subtracting one from the other cannot establish unused production potential.
Before interpreting a production difference, the capacity reference and physical system being measured must first be defined.
Freeport LNG – When available equipment cannot deliver LNG
On 8 June 2022, a fire at Freeport LNG resulted in the complete shutdown of the terminal. The US Energy Information Administration reported that the interruption removed approximately 2 billion cubic feet per day of export capability, equivalent to around 17% of US LNG export capacity at the time.
The EIA also reported that the incident involved LNG transfer infrastructure and did not damage the principal liquefaction trains, storage tanks or main process areas.
The liquefaction trains could remain physically intact while the integrated export system was unable to deliver LNG. An equipment-level assessment could therefore reach a different conclusion from an assessment of dependable LNG exports. Neither would necessarily be incorrect; the error would arise from treating them as interchangeable.
For refrigeration-equipment reliability, the relevant boundary may be the liquefaction train and supporting machinery. For supply dependability, the boundary extends through the infrastructure required to deliver LNG to export vessels.
Similar reductions in delivered LNG may arise from different technical constraints, with different implications for reliability investment and operating expectations. The benchmark must follow the decision being examined, rather than the availability of a convenient performance measure.
US terminal utilisation – A reported increase is not an improvement opportunity
Energy Ventures Analysis examined US LNG export terminal utilisation using EIA and US Census information. Its March 2024 study reported that average utilisation across US terminals excluding Freeport increased from approximately 86% in 2021 to 91% in 2022.
The report explained that the increase was primarily associated with the recent completion of Calcasieu Pass and the absence of a planned maintenance outage during its initial operating period.
The five-percentage-point difference is a change in a published aggregate measure. It is not evidence that every established terminal improved, that mature-facility operating practices became more effective, or that another facility could achieve five additional percentage points of utilisation.
The comparison combines facilities at different stages of operating maturity. A newly commissioned facility may not yet have entered the maintenance cycle characteristic of a mature installation.
The study was prepared principally to examine the relationship between LNG exports and US natural-gas prices. Its utilisation analysis was not constructed as an independent assessment of achievable production potential across comparable LNG systems.
The evidence supports a change in reported aggregate utilisation, partly explained by commissioning effects. It does not establish a corresponding improvement in mature-facility operating effectiveness.
Corpus Christi – The denominator is part of the engineering question
Corpus Christi Stage 3 comprises seven midscale liquefaction trains. Production began in December 2024, and additional trains entered service progressively. The seventh and final train was completed in August 2026.
The EIA reported that the completed expansion increased the facility's nominal capacity to approximately 3.1 billion cubic feet per day. The facility did not possess that final installed capacity throughout the development period.
Dividing annual production by year-end installed capacity may therefore understate the performance of equipment available during earlier months. Conversely, excluding newly commissioned trains may be appropriate for mature-train reliability but inappropriate for measuring the total contribution of the expanded facility to LNG supply.
| Assessment purpose | Relevant comparison | What it establishes |
|---|---|---|
| Commissioning performance | Delivered production versus capacity expected under the approved commissioning schedule | Performance against the commissioning plan |
| Mature-train reliability | Production and availability of established trains over a consistent operating period | Performance of equipment in established service |
| Total supply contribution | Actual LNG delivered during the reporting period | Delivered supply, regardless of commissioning status |
Each measure can be legitimate for its stated purpose. They do not establish the same proposition.
The denominator is not merely an accounting convention. It is part of the engineering interpretation.
Three distinct explanations – One familiar performance measure
The three examples demonstrate different mechanisms affecting the interpretation of LNG utilisation. They are not presented as evidence of poor operating performance at any named facility.
Similar annual utilisation figures can conceal different operating histories: frequent short interruptions, a single extended outage or sustained feedgas constraints. Their reliability mechanisms and implications for production persistence are not equivalent.
| Published evidence | Comparison issue | Inference that is not established |
|---|---|---|
| Freeport LNG 2022 shutdown | System boundary | Equipment integrity establishes dependable LNG export capability |
| Calcasieu Pass Commissioning effect in US aggregate | Comparator population | Higher aggregate utilisation demonstrates improved mature-facility operating effectiveness |
| Corpus Christi Stage 3 progressive commissioning | Capacity reference | Year-end installed capacity was available throughout the reporting year |
A defensible assessment must establish the relevant system boundary, comparator population and capacity reference before interpreting an observed result. It must then identify material causes such as commissioning, feedgas constraints, maintenance and exceptional interruptions.
Only after these differences are reconciled can a residual be examined. That residual is not automatically evidence of underperformance. It may reflect incomplete data, unsuitable comparators or unrecognised physical constraints.
Independent comparison tests an established expectation; it does not automatically replace it. An unexplained residual may reflect missing evidence, imperfect comparability or an unrecognised constraint. Achievable potential requires additional evidence that the alternative outcome is transferable to the system being assessed.
An observed difference is a measurement. An unexplained residual is a question. An achievable opportunity requires evidence that a different outcome is attainable under sufficiently comparable conditions.
The highest reported utilisation is not automatically a valid expectation for every other facility. Equally, a technically plausible explanation for lower utilisation does not necessarily establish the limit of achievable performance.
When a credible forecast does not settle the achievable-potential question
LNG operators employ sophisticated reliability engineering, maintenance planning, production forecasting and technical assurance processes. An established forecast may accurately represent performance expected under its assumptions.
But the credibility of the forecast does not independently establish whether those assumptions represent the most demanding achievable operating expectation.
Consider a facility whose annual plan incorporates recurring equipment interruptions. The operator may understand the failure mechanisms, maintenance requirements and production consequences in considerable detail. The forecast may be technically sound.
The unresolved question is whether genuinely comparable systems have demonstrated different interruption frequencies, durations or production consequences under sufficiently similar conditions.
External evidence may confirm the established expectation, show that an apparent comparator is unsuitable, or identify a difference that remains unexplained. None of these outcomes should be assumed in advance.
Three questions must be kept separate: Did the asset meet its plan? Was that plan technically credible? And has the expected performance been independently tested against what sufficiently comparable systems have demonstrated? The first two answers do not settle the third.
The investment consequence
The distinction becomes particularly important when considering whether to invest in additional liquefaction capacity or improve the dependability of existing infrastructure. Both may increase future LNG supply. Their relative merit depends upon achievable production, capital cost, operating expenditure, timing, risk and wider system constraints.
A credible expansion proposal does not demonstrate that existing infrastructure has exhausted its production potential. Equally, a possible improvement to existing-system performance does not establish that it is economically preferable.
The question does not presume expansion is the wrong decision. It tests whether the evidence supporting the choice is sufficiently complete.
Five questions for LNG operating and investment leadership
These questions do not presume that any named facility is underperforming. They test whether established expectations and capital decisions have been challenged against sufficiently comparable evidence.
- What independent evidence establishes that our production expectations are sufficiently demanding?
- Which reported utilisation differences disappear once commissioning, operating conditions, system boundaries and capacity definitions are reconciled?
- Where have recurring interruptions become accepted assumptions in production forecasts rather than questions about achievable operating performance?
- Have genuinely comparable LNG systems demonstrated different interruption frequencies, durations or production consequences under sufficiently similar conditions?
- Before approving additional liquefaction capacity, have we adequately tested the achievable production potential of infrastructure already installed?
Dependable production and energy security
International LNG supply depends upon continuing availability across upstream gas, processing infrastructure, liquefaction equipment, utilities, storage and export systems.
Freeport demonstrated how interruption of one critical element could remove substantial export capability. Corpus Christi demonstrates how new capacity becomes available progressively.
Installed capacity and dependable LNG supply are therefore not equivalent measures.
For importing countries, this distinction matters when assessing supply security. For operators, it informs production expectations and reliability investment. For investors, it affects the relationship between installed assets, sustained production and future cash flows.
Improving the dependability of existing infrastructure may contribute additional LNG supply without equivalent new liquefaction capacity. But the scale and economics of any opportunity must be established through evidence; they cannot be inferred from the difference between installed capacity and reported production.
Conclusions – What remains achievable?
The ten LNG complexes illustrate the scale and diversity of major liquefaction infrastructure. Their installed capacities do not establish which operators achieve the highest operating effectiveness, nor quantify additional production that may remain achievable.
Freeport shows that the system boundary can change the interpretation of performance. Calcasieu Pass shows that the comparator population can influence aggregate utilisation. Corpus Christi shows that commissioning history can change the relevant capacity reference.
These are demonstrated limitations of conventional LNG comparisons. They are not evidence of avoidable production losses.
Benchmarking is the discipline of establishing what world-class looks like under comparable conditions — and understanding how far performance remains from that potential.
For LNG, this requires establishing which differences are explained by material operating conditions, which comparisons remain valid and what residual differences warrant investigation.
A credible assessment may confirm that existing expectations are sufficiently demanding, demonstrate that apparent comparators are unsuitable, or identify an unexplained difference deserving closer examination. Each is a legitimate outcome.
The central question is not simply whether established production targets are being achieved, but whether those targets and the investment decisions they support have been tested against what genuinely comparable operating systems demonstrate remains achievable.
A facility can be operating competently, meeting its production plan and satisfying its established technical expectations without those achievements independently establishing the limits of its performance potential.
The most consequential LNG benchmark is not installed capacity, or even reported utilisation. It is what remains achievable under genuinely comparable conditions.
References
- US Energy Information Administration (2022). “Fire causes shutdown of Freeport liquefied natural gas export terminal.” 23 June. EIA article.
- Energy Ventures Analysis (2024). Impact Analysis of U.S. Natural Gas Exports on Domestic Natural Gas Pricing. March, Exhibit 24, p. 26; submitted in US Department of Energy Docket No. 24-87-LNG. Full report (PDF).
- US Energy Information Administration (2026). “Corpus Christi LNG expansion makes facility the second-largest in the United States.” 15 September. EIA article.
Fulcrium Reference Publications
- Fulcrium Benchmarking Service Page. LNG Asset Performance Benchmarking. Examines integrated LNG asset performance across production, reliability, energy, maintenance, cost and supporting systems, using independent comparative evidence.
- Fulcrium Benchmarking Service Page. Gas Processing Benchmarking. Examines performance across interconnected gas reception, treatment, compression, recovery, utilities and export systems, including the constraints at their interfaces.
- Fulcrium (12 January 2026). When Is an Optimised Asset Actually Performing Near Its Potential?. Explores why successful optimisation against established targets does not necessarily establish the limits of achievable asset performance.
- Fulcrium (7 April 2026). Gas & LNG Systems Benchmarking. Sets out the integrated gas and LNG systems perspective, linking performance across connected production, processing and export infrastructure.
- Fulcrium (2 March 2026). Facilities, Plants & Processing Benchmarking. Explains the comparative assessment of facilities and processing systems, recognising differences in configuration, operating conditions and technical constraints.
- Fulcrium (14 February 2026). Why Similar LNG Assets Perform Differently – What Can We Really Learn From Other Operators?. Examines why superficially similar LNG assets can deliver different outcomes and what can legitimately be inferred from other operators’ experience.
- Fulcrium Benchmarking Service Page. LNG Process Safety Culture Benchmarking. Addresses LNG process safety culture benchmarking and the need to interpret organisational and operational practices within their relevant context.
 '
